| top > global warming > global ghg Why are global GHG emissions increasing? It’s no surprise! By: Yuzo Tanaka, Japanese Researcher January 13, 2025 It was reported by the media during COP29 that global CO2 emissions from fossil fuels reached a record high in 2024 and there is still “no sign” that the world has reached a peak, according to new research by the Global Carbon Project – one of the contributors to WMO's United in Science reports. Why are global greenhouse gases increasing? The following explains why. Introduction There is a great deal of interest in global warming. Figure 1 uses data from Berkeley Earth.The Paris Agreement aims to limit the rise in global average temperature to less than 2℃, aiming for 1.5℃, but it is certain that it will exceed 1.5℃ in the 2030s. 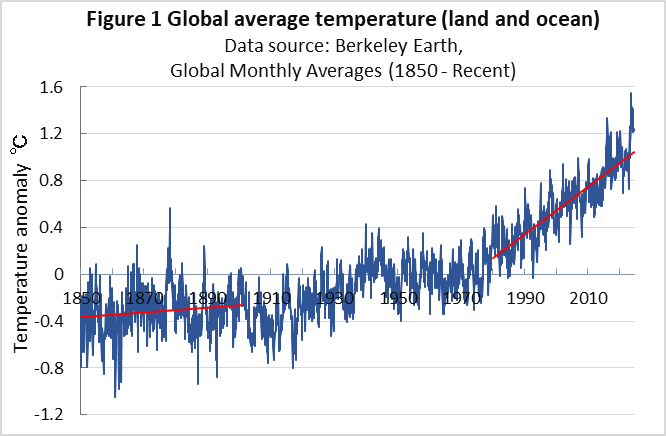 Figure 2 uses data downloaded from Climate Watch's Data Explorer. 9 years have passed since the adoption of the Paris Agreement, but global greenhouse gas (GHG) emissions continue to increase. 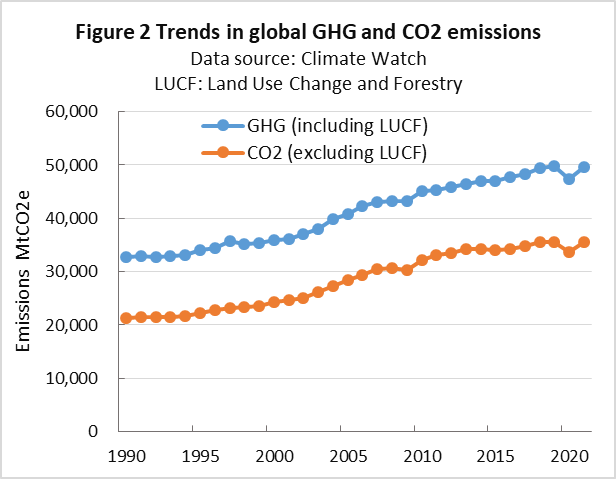 While GHG emissions in developed countries are decreasing, emissions in developing countries, which account for about two-thirds of global GHG emissions, continue to increase. The target cannot be achieved if only developed countries reduce their emissions. 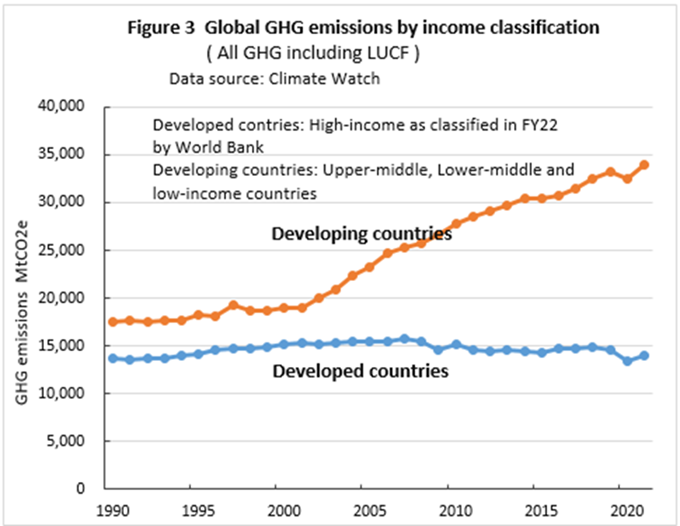 Classification of countries around the world by income level This report classifies countries around the world into groups based on income level, and shows GHG emissions and their reduction status in relation to wealth. As shown in Table 1, the classification of each country is based on the World Bank's four-level classification by GNI per capita for FY22.  According to the World Bank's classification, the EU-28 countries, including the UK, which has a large impact on reducing GHG emissions, are classified as High income countries except for Bulgaria, and China is classified as an Upper-middle income country. In this report, High income countries excluding the EU-28 countries are named "High income-mod.", and the combined group of Upper-middle income countries and Lower-middle income countries excluding China is named "Middle income-mod.". The GHG emissions, GDP, etc. of about 200 countries and regions around the world were compiled, divided into five groups. The most significant drivers of GHG emissions growth are middle-income countries, including China, which accounts for three-quarters of the world's population but less than 40% of its GDP in 2022. 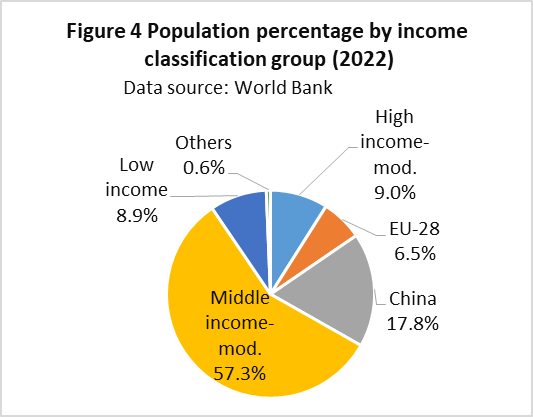 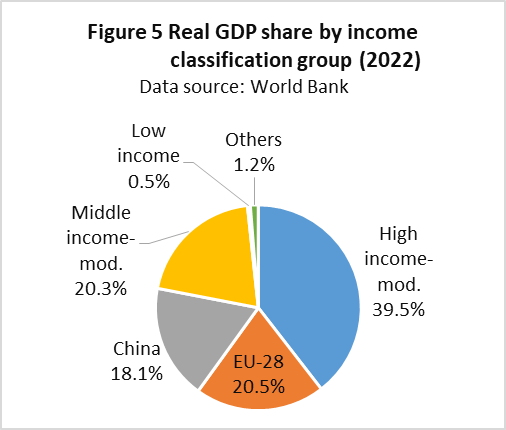 Middle-income country emissions As shown in Figure 6, GHG emissions from the EU-28 have continued to decline, and High income-mod. have also started to decline in recent years. Meanwhile, Middle income-mod. and China, in addition to having large GHG emissions, have continued to increase significantly. Low income countries have also increased, but their emissions are low. 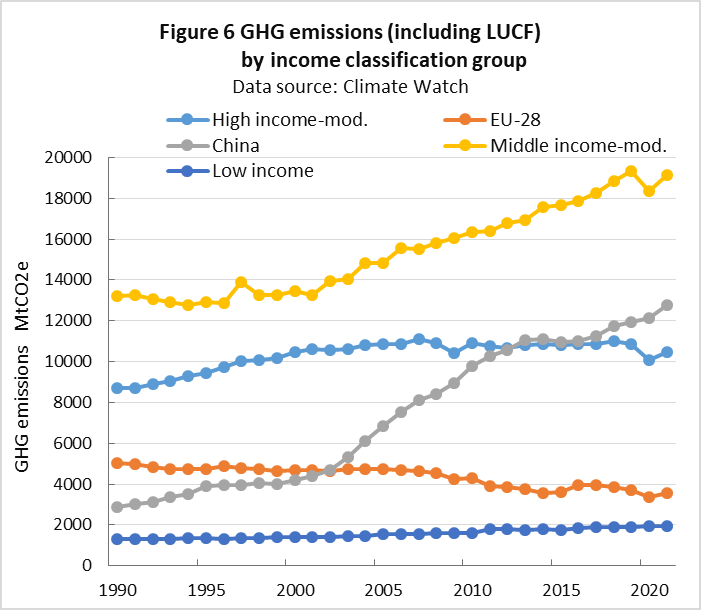 It is natural that large countries with large populations have large GHG emissions. GHG emissions per capita is an easy-to-understand indicator for comparing the amount of GHG emissions of each country and evaluating the lack of reduction efforts. Figure 7 shows the trends in per capita GHG emissions for each group. 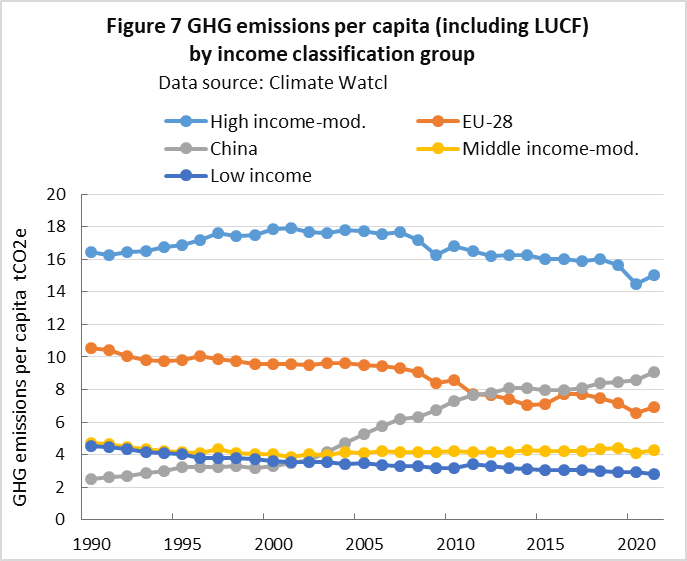 In recent years, the per capita GHG emissions of Middle income-mod. have been less than one-third of those of High income-mod.. Even compared to the EU-28, where GHG emissions reductions have been progressing, the figure is only about 60% lower. It is not surprising that Middle income-mod. are not proactive in reducing GHG emissions, which entails economic burdens. Figure 8 shows the trend of real GDP per capita. In recent years, the value of Middle income-mod. has been extremely low, less than one-tenth of that of High income-mod., and 12% of that of the EU-28. It is natural for Middle income-mod. to aim for economic growth. However, economic growth increases energy consumption and GHG emissions. 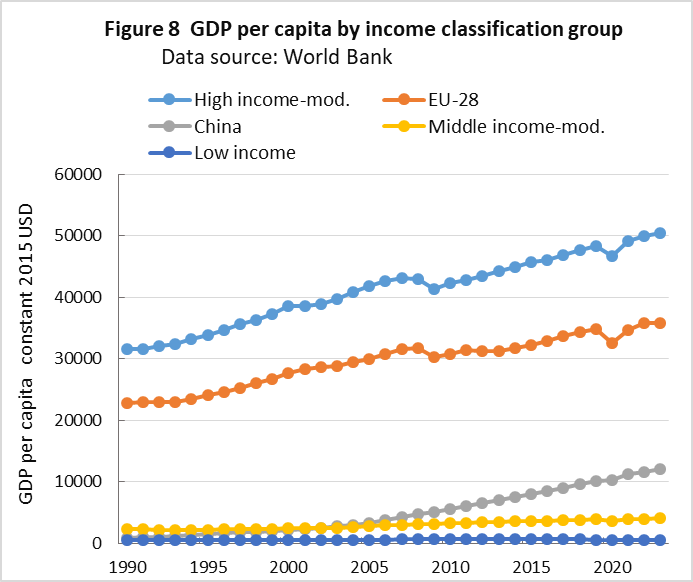 Figure 9 shows the trends in GDP growth rates for each group. This was calculated from the annual change in real GDP. Because the fluctuations are large and difficult to understand, a three-period moving average is also shown.  Growth rates in recent years have fluctuated due to the COVID-19 pandemic, but while High income-mod. and the EU-28 have grown at less than 2%, Middle income-mod. have remained at around 3% or higher. The concept of green growth was proposed around 2010, but it has since been pointed out that it is only work with low growth. Another reason for the decline in GHG emissions in developed countries in recent years is that manufacturing has been shifting from developed to developing countries. Figure 10, using international data from the U.S. Energy Information Administration shows trends in primary energy supply for each group.  In recent years, primary energy supplies in the EU-28 have been declining slowly, with High income-mod. remaining roughly stable, while China and Middle income-mod. have increased substantially. As with primary energy supply in Figure 10, electricity demand in the EU-28 is gradually decreasing, while electricity demand in High income-mod. is almost flat. In contrast, electricity demand in China and Middle income-mod. is increasing significantly.  Such trends in electricity demand affect the expansion of wind and solar power generation. Since high income countries do not have an increase in electricity demand, they only need to introduce and expand wind and solar power generation to reduce CO2 emissions. In contrast, middle income countries are required to meet the electricity demand and reduce CO2 emissions. A stable supply of cheap electricity is essential for economic growth. As a result, middle-income countries, which are striving for economic growth but lack funds for capital investment, will respond to increased electricity demand by expanding traditional power generation such as fossil fuel power plants, and will gradually introduce wind and solar power within their surplus capacity. As shown in Figure 12, the EU-28, which has led the introduction of renewable energy, has the highest ratio of wind and solar power generation, followed by High income-mod., China, and Middle income-mod., with a clear division.  To repeat, the current per capita GHG emissions in Middle income-mod. are less than one-third of those in High income-mod., and their per capita GDP is less than one-tenth. It is not surprising that Middle income-mod. pursue economic growth and are reluctant to reduce GHG emissions, which are an economic burden. So what should we do? My thoughts on this, including China's GHG emission reductions, are presented in the second half of the report below. It's no surprise that global GHG emissions aren't decreasing |